The story happened with a webshop application running on Amazon EC2 microinstances. Actually on two instance. Amazon business model is basically simple, they ask money for only three things: Cpu time, IOPS and network traffic. Everybody (including me) thinks for the first time network traffic will be the bottleneck until they got the first bill (it can be even after one year considering the free tier). Actually in this category the IOPS is the most expensive.
Symptoms
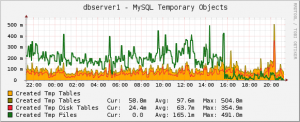
On the cacti diagrams I saw strange datas. The created temp tables on disk and created temp files were much higher than created temp tables. The 67% of temporary tables were created on disk. This is very far from optimal.
Quick patch
II increased the max_heap_table_size and tmp_table_size from 72MB to 128MB. Together with the increased max_tmp_tables ( 32->128) this dramatically decreased the number of created files. We can spare a little money.
|
1 2 3 |
<del>set global max_tmp_tables = 128;</del> set global max_heap_table_size = 134217728; set global tmp_table_size = 134217728; |
Update 2014. 06. 03.: As Ankit kindly drew it to my attention the max_tmp_table variable is deprecated in the latest MySQL versions. http://dev.mysql.com/doc/refman/5.6/en/server-system-variables.html#sysvar_max_tmp_tables
Further investigation
We have to find out what was changed and why was created so many tmp objects. To do this I turn on slow query log with log_queries_not_using_indexes. (Some thinks on production environment slow log isn’t supposed to be turned on. I used to ask them where else should it be then if not on the real queries? ). While MySQL were collecting datas for me I could take a look at the previously created new graph in cacti which shows us the handlers’ counter from SHOW GLOBAL STATUS.
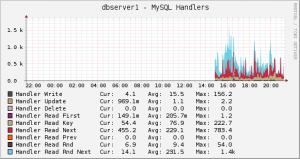
The significant number of handler_read_rnd and handler_read_rnd_next show that MySQL has to make full scan for finding the requested rows during queries. This could and should be avoided by using indexes for queries, joins and order by.
Solution
After consulting with the developers we can fix the most of the queries. The MySQL slow log proved our former assumption. There were a lot of query needed full scan and examined all the rows. On the second diagram shows how the random reads fells down when the queries are improved one by one.
Conclusion
I have to mention that the site wasn’t slow. Every page loaded was generated under 700-900ms. But you should monitor and watch for trends even when the application is running smoothly. With this kind of proactive and preventive fixes Amazon bills can be kept reasonably low.


Recent comments